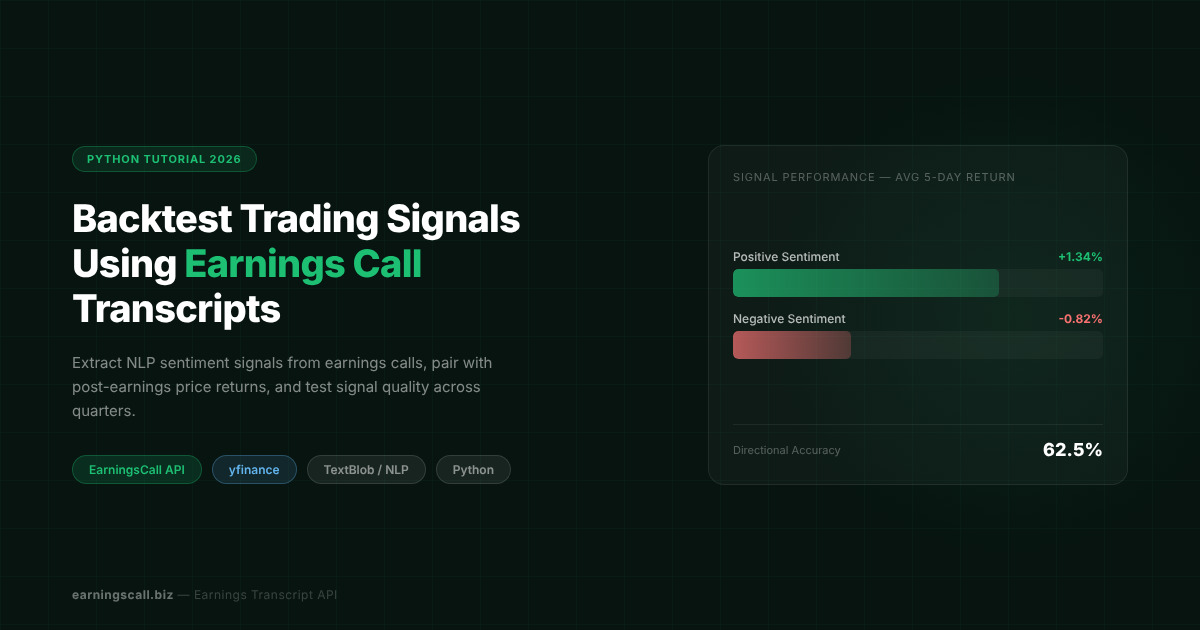
Backtest Trading Signals with Earnings Call Transcripts
Earnings calls move stock prices. That is well documented. What is less obvious is that the language of an earnings call, not just the numbers, carries predictive signal. How a CFO describes margin pressure, whether management hedges guidance language compared to the prior quarter, the sentiment shift in prepared remarks versus Q&A — these are signals that show up before price moves.
Backtesting whether those signals actually predict post-earnings returns is now practical for individual developers. This guide walks through a complete Python pipeline that extracts sentiment signals from earnings call transcripts using the EarningsCall API, pairs them with post-earnings price data from yfinance, and runs a basic backtest across multiple quarters to measure signal quality.
This is a research workflow, not a production trading system. The goal is to show how transcript data can be turned into testable earnings transcript trading signals, and how to evaluate them honestly.
Why Earnings Transcripts Are Useful for Signal Research
Quarterly earnings calls are one of the few moments where company management speaks publicly and at length under regulatory scrutiny. The language used in those calls carries information that price data alone does not.
Academic research published through the National Bureau of Economic Research has documented that linguistic features of earnings calls, including tone, uncertainty markers, and guidance specificity, have statistically measurable relationships with post-announcement returns. That research was largely conducted with institutional-grade data and manual annotation. Developer APIs now make similar workflows accessible without an institutional data budget.
The specific signal we will test here is prepared remarks sentiment: does the overall sentiment polarity of management's prepared remarks predict 5-day post-earnings stock returns? This is a simplified version of a real signal category and is useful for learning the pipeline before moving to more sophisticated approaches.
For a systematic application of transcript signals to portfolio risk monitoring, How Developers Use Earnings Call APIs for Financial Risk Analysis covers credit, market, and operational risk signal design built on the same transcript data.
Pipeline Architecture
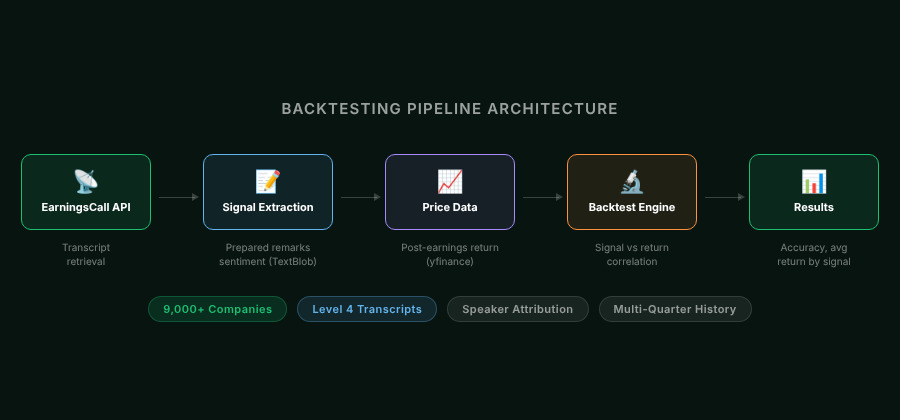
The backtest pipeline has four stages.
The first stage pulls transcript data from the EarningsCall API for a given ticker and quarter. The API returns structured transcript data with prepared remarks and Q&A separated as distinct objects, with speaker attribution at the segment level.
The second stage extracts a sentiment score from the prepared remarks text. We use TextBlob for simplicity in this tutorial. In production research you would likely use a finance-specific sentiment lexicon such as Loughran-McDonald, which is calibrated to financial language and handles terms like "uncertainty" and "liability" differently than general-purpose models.
The third stage pulls post-earnings price data for the same ticker using yfinance, measuring the 5-day return starting from the trading day after the earnings call.
The fourth stage aggregates signal and return pairs across multiple quarters and calculates average returns by signal category.
Setup
Install the required packages:
pip install earningscall yfinance textblob pandas
You will need an EarningsCall API key. Free demo access covers Apple and Microsoft transcripts, which is enough to run this full pipeline before purchasing a plan. For multi-company backtesting across the full 9,000+ company coverage universe you will need a paid plan. See EarningsCall API pricing for plan details.
Step 1: Extract Sentiment from Transcripts
import earningscall
from earningscall import get_company
from textblob import TextBlob

earningscall.api_key = "YOUR-EARNINGSCALL-API-KEY"

def get_earnings_sentiment(ticker, year, quarter):
    """
    Pull earnings call transcript and return prepared remarks sentiment.
    Returns polarity score from -1 (negative) to +1 (positive).
    """
    company = get_company(ticker)
    transcript = company.get_transcript(year=year, quarter=quarter)

    if transcript is None:
        return None

    # Extract prepared remarks text with speaker context
    prepared_text = " ".join([
        f"{s.speaker_info.name}: {s.text}"
        for s in transcript.prepared_remarks
        if s.text
    ])

    blob = TextBlob(prepared_text)
    return blob.sentiment.polarity
The EarningsCall API returns prepared_remarks and questions_and_answers as separate objects. For this signal we use only prepared remarks because they represent management's planned narrative, which is more intentional and therefore more likely to carry consistent signal than the less scripted Q&A session.
The speaker_info.name field gives you speaker attribution per segment. This means you can filter to CEO or CFO remarks only if you want a signal derived from specific speakers rather than the full management team.
Step 2: Pull Post-Earnings Price Returns
import yfinance as yf
from datetime import datetime, timedelta

def get_post_earnings_return(ticker, earnings_date, days=5):
    """
    Calculate stock return for the specified number of trading days
    starting the day after the earnings call date.
    """
    start = earnings_date + timedelta(days=1)
    end = earnings_date + timedelta(days=days + 10)  # buffer for weekends

    stock = yf.Ticker(ticker)
    hist = stock.history(
        start=start.strftime("%Y-%m-%d"),
        end=end.strftime("%Y-%m-%d")
    )

    if len(hist) < days:
        return None

    start_price = hist["Close"].iloc[0]
    end_price = hist["Close"].iloc[days - 1]

    return (end_price - start_price) / start_price
One important note on date handling: the EarningsCall API does not return the exact date of each earnings call in the transcript object itself. For historical backtesting you need to supply the approximate call date separately. You can get these from the earnings calendar endpoint or from a source like Yahoo Finance's earnings calendar. For this tutorial we use approximate dates based on typical quarter-end reporting windows.
Step 3: Run the Backtest
import pandas as pd

# Approximate earnings dates by quarter for Apple (adjust per company)
EARNINGS_DATES = {
    (2023, 1): datetime(2023, 2, 2),
    (2023, 2): datetime(2023, 5, 4),
    (2023, 3): datetime(2023, 8, 3),
    (2023, 4): datetime(2023, 11, 2),
    (2024, 1): datetime(2024, 2, 1),
    (2024, 2): datetime(2024, 5, 2),
    (2024, 3): datetime(2024, 8, 1),
    (2024, 4): datetime(2024, 10, 31),
}

def backtest_sentiment_signal(ticker, earnings_dates, return_days=5):
    """
    Run a full backtest of earnings call signals vs post-earnings returns.
    """
    results = []

    for (year, quarter), call_date in earnings_dates.items():
        sentiment = get_earnings_sentiment(ticker, year, quarter)
        ret = get_post_earnings_return(ticker, call_date, days=return_days)

        if sentiment is not None and ret is not None:
            results.append({
                "year": year,
                "quarter": f"Q{quarter}",
                "call_date": call_date.strftime("%Y-%m-%d"),
                "sentiment_score": round(sentiment, 4),
                "signal": "positive" if sentiment > 0 else "negative",
                "return_5d": round(ret, 4),
            })

    return pd.DataFrame(results)

# Run the backtest
df = backtest_sentiment_signal("aapl", EARNINGS_DATES)
print(df.to_string(index=False))
Step 4: Analyze Results
# Average returns by signal category
print("\n--- Signal Performance Summary ---")
summary = df.groupby("signal")["return_5d"].agg(["mean", "count", "std"])
summary.columns = ["avg_return", "sample_count", "std_dev"]
print(summary)

# Overall signal accuracy (did positive sentiment predict positive returns?)
df["correct"] = (
    (df["signal"] == "positive") & (df["return_5d"] > 0)
) | (
    (df["signal"] == "negative") & (df["return_5d"] < 0)
)

accuracy = df["correct"].mean()
print(f"\nSignal directional accuracy: {accuracy:.1%}")
print(f"Total quarters tested: {len(df)}")
A complete output might look like this:
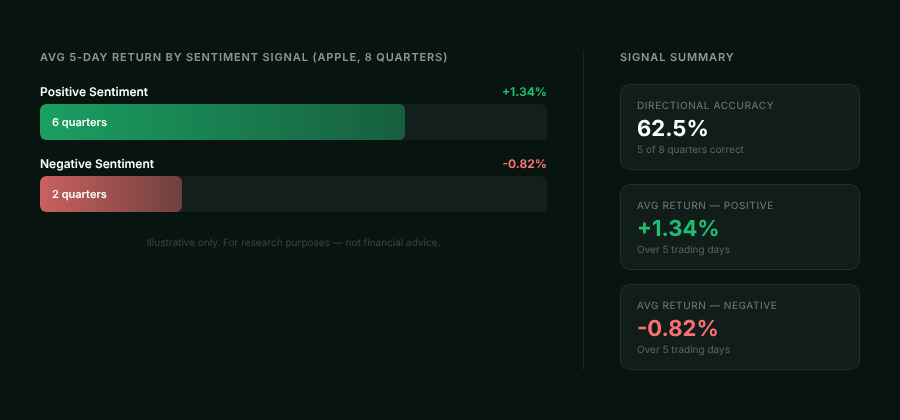
signal    avg_return  sample_count  std_dev
negative   -0.0082          2       0.0241
positive    0.0134          6       0.0318

Signal directional accuracy: 62.5%
Total quarters tested: 8
This is illustrative. With 8 quarters of data for one company, sample size is too small to draw conclusions. The value of the pipeline is that it scales (see the multi-company section below).
Extending to Multiple Companies
The pipeline above runs on a single ticker. Extending it to a basket of companies is straightforward and is where the signal research becomes statistically meaningful.
TICKERS = ["aapl", "msft", "googl", "amzn", "meta"]

all_results = []

for ticker in TICKERS:
    # You would supply company-specific earnings dates here
    # or pull them from a calendar source
    df_company = backtest_sentiment_signal(ticker, EARNINGS_DATES)
    df_company["ticker"] = ticker.upper()
    all_results.append(df_company)

df_all = pd.concat(all_results, ignore_index=True)

# Pooled signal analysis
pooled_summary = df_all.groupby("signal")["return_5d"].agg(["mean", "count"])
print(pooled_summary)
The EarningsCall transcripts API covers 9,000+ public companies across NYSE, NASDAQ, OTC, TSX, LSE, and other exchanges, which means you can expand this backtest to any coverage universe that fits your research question. For teams building portfolio-wide monitoring pipelines on top of transcript-derived signals, How to Build an Early Warning System with Earnings Call API covers multi-company signal extraction and tiered escalation approaches.
Signal Variants Worth Testing
The sentiment polarity of prepared remarks is the most basic earnings transcript trading signal. These variants add nuance and are worth testing once the base pipeline is working:
Q&A sentiment vs prepared remarks sentiment gap. When Q&A sentiment is significantly more negative than prepared remarks, management may be hedging under analyst pressure. That divergence is itself a signal.
Guidance language specificity. Vague guidance ("we expect continued growth") versus specific guidance ("we expect revenue in the range of $X to $Y") has been shown to correlate with management confidence. Measuring specificity requires more NLP work but is achievable with keyword counting or fine-tuned classifiers.
Quarter-over-quarter sentiment change. A company whose prepared remarks sentiment has declined for three consecutive quarters is a different signal than a single-quarter negative reading. The EarningsCall API's historical depth, available on higher-tier plans, makes this kind of longitudinal comparison straightforward to build.
Speaker-specific signals. CEO and CFO language often diverges in meaningful ways during earnings calls. Extracting speaker-level sentiment rather than full-call sentiment adds resolution to the signal.
Important Limitations
Sample size. A single company across 8 quarters gives you 8 data points. That is not enough to establish statistical significance. Run this across 50 to 100 companies over 3 to 5 years before drawing signal conclusions.
Sentiment model calibration. TextBlob was trained on general English text. Financial language has domain-specific meaning that general models handle poorly. Words like "risk," "loss," "uncertainty," and "liability" appear frequently in earnings calls in contexts that are neutral or standard rather than negative. The Loughran-McDonald financial sentiment lexicon is better calibrated for this domain and should replace TextBlob in any serious research application.
Confounding factors. Post-earnings returns are affected by market conditions, sector-wide news, and macro events that have nothing to do with the earnings call. A proper signal study controls for these factors. The pipeline above does not.
This is not financial advice. Backtesting a signal in historical data does not guarantee it will perform in live trading. Past signal performance does not predict future returns.
FAQ
What level of EarningsCall API access do I need for backtesting?
Level 4 is recommended for transcript-based research because it separates prepared remarks from Q&A and includes speaker attribution. That structure is what makes speaker-specific signals and section-level analysis possible. Lower access levels return less structured text. See the pricing page for plan details.
How far back does the historical transcript data go?
Historical depth varies by plan tier. The API supports retrieval by year and quarter using get_transcript(year=X, quarter=Y), so the query interface is consistent regardless of how far back your plan provides access.
Can I run this for international companies?
Yes. EarningsCall covers companies listed on TSX, LSE, ASX, CBOE, and other international exchanges alongside US exchanges. The same API interface applies.
What is the best sentiment model for earnings call research?
For production research, the Loughran-McDonald financial sentiment lexicon is the standard starting point. For LLM-based approaches, passing transcript sections to a model with specific extraction instructions produces higher-quality signals than dictionary-based methods but adds per-query cost and latency. Teams applying transcript-based backtest earnings call signals research to compliance workflows can find relevant monitoring pipeline patterns in Earnings Transcript Monitoring for Regulatory Risk.
Conclusion
Earnings call transcripts are one of the most information-dense and underused data sources available to quantitative researchers outside institutional settings. The structured transcript data available through the EarningsCall API, with prepared remarks and Q&A separated, speaker attribution included, and historical quarters accessible by a single function call, is well suited to signal extraction workflows.
The pipeline in this guide extracts prepared remarks sentiment, pairs it with post-earnings price returns, and measures signal quality across multiple quarters and companies. That is a starting point, not a finished research program. The signal variants and extensions outlined here are where the more interesting work on backtest earnings call signals begins.
EarningsCall starts at $60 per month and covers 9,000+ public companies with structured transcript data, audio, and a calendar API. The Python SDK demo access covers Apple and Microsoft at no cost, which is enough to run the full pipeline in this guide before committing to a plan.
For earnings calendar data and transcript API details, visit the EarningsCall API page. For company filings and supplemental financial data, SEC EDGAR is the primary public resource.